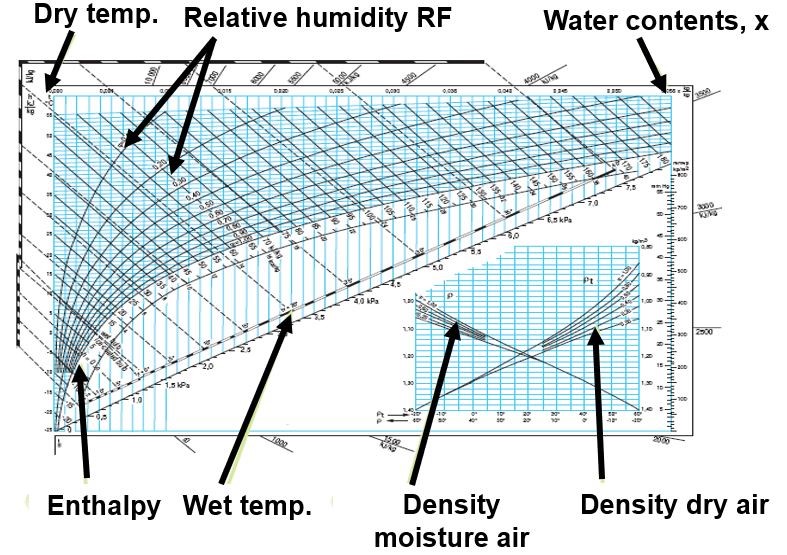
Following the lines in the Mollier diagram gives you insight into what happens to the climate. For a good, step-by-step explanation take a look at chapter 6 about the Mollier diagram in the Mushroom Signals book. Mollier diagram Oct 09, 2018.


If we divide the water vapor content by two, the air is on a half saturated line, that is to say at Hr = 50% (we can also write: ϕ = 50%).


 0 kommentar(er)
